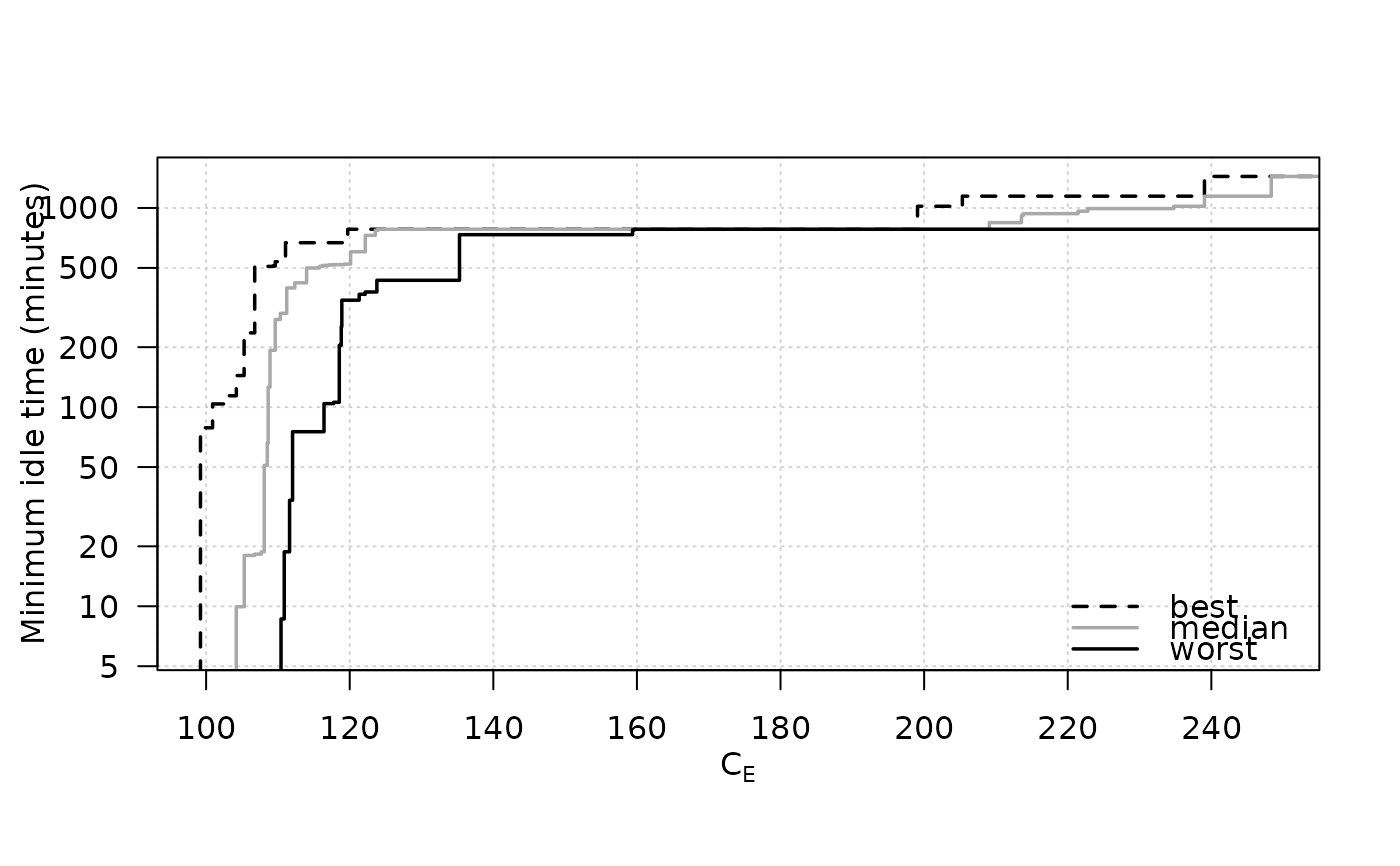
Results of SPEA2 when minimising electrical cost and maximising the minimum idle time of pumps on Richmond water network.
Source:R/eaf-package.R
SPEA2minstoptimeRichmond.RdThe data has the only goal of providing an example of use of eafplot.
Format
A data frame as produced by read_datasets(). The second
column measures time in seconds and corresponds to a maximisation problem.
Examples
data(HybridGA)
data(SPEA2minstoptimeRichmond)
SPEA2minstoptimeRichmond[,2] <- SPEA2minstoptimeRichmond[,2] / 60
eafplot (SPEA2minstoptimeRichmond, xlab = expression(C[E]),
         ylab = "Minimum idle time (minutes)", maximise = c(FALSE, TRUE),
         las = 1, log = "y", legend.pos = "bottomright")