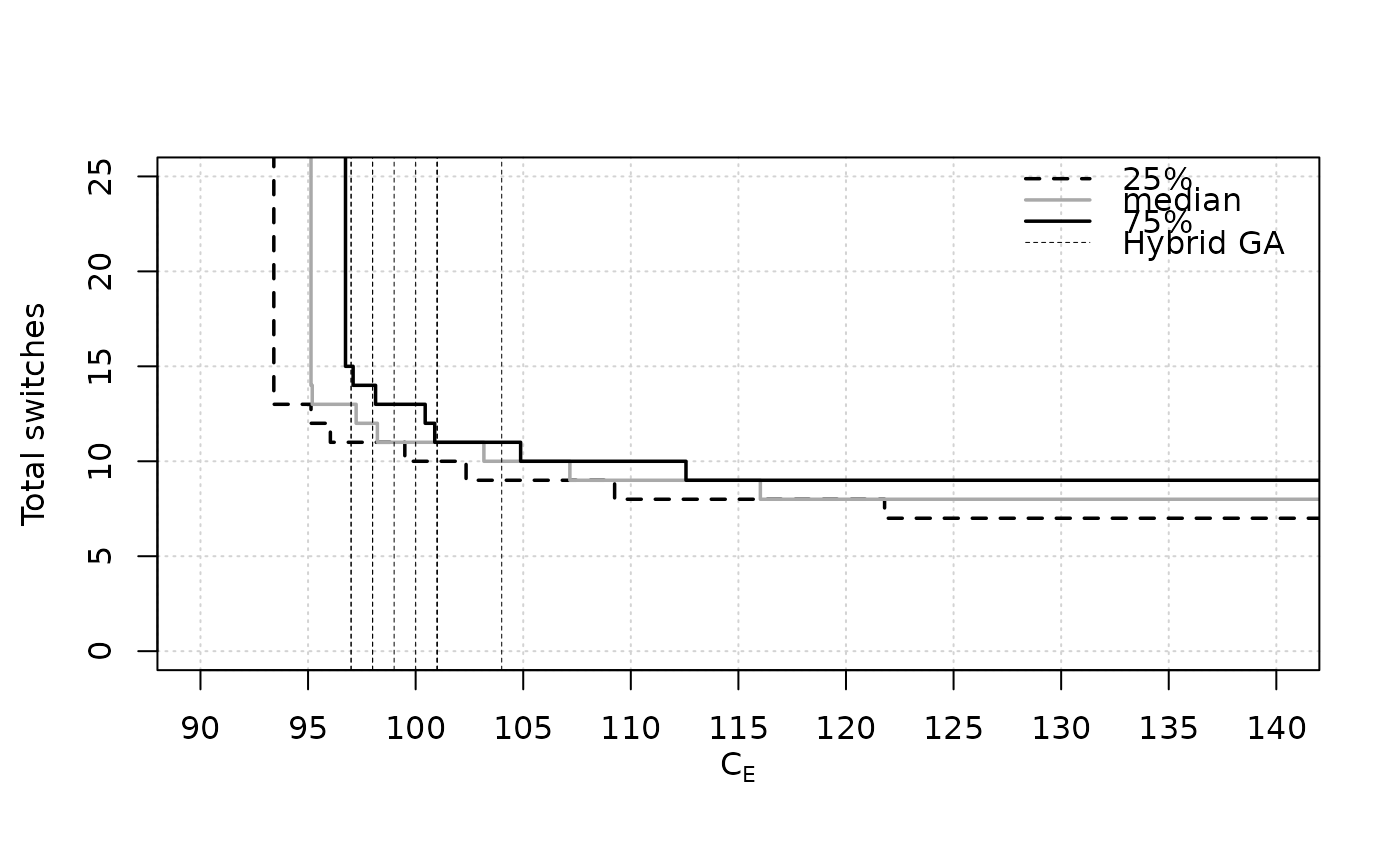
Skip to contents

The data has the only goal of providing an example of use of eafplot.

Usage

SPEA2relativeRichmond

Format

A data frame as produced by read_datasets().

Source

Manuel López-Ibáñez (2009). Operational Optimisation of Water Distribution Networks. Ph.D. thesis, School of Engineering and the Built Environment, Edinburgh Napier University, UK. https://researchrepository.napier.ac.uk/id/eprint/3044.

Examples

data(HybridGA)
data(SPEA2relativeRichmond)
eafplot (SPEA2relativeRichmond, percentiles = c(25, 50, 75),
        xlab = expression(C[E]), ylab = "Total switches",
        xlim = c(90, 140), ylim = c(0, 25),
        extra.points = HybridGA$richmond, extra.lty = "dashed",
        extra.legend = "Hybrid GA")