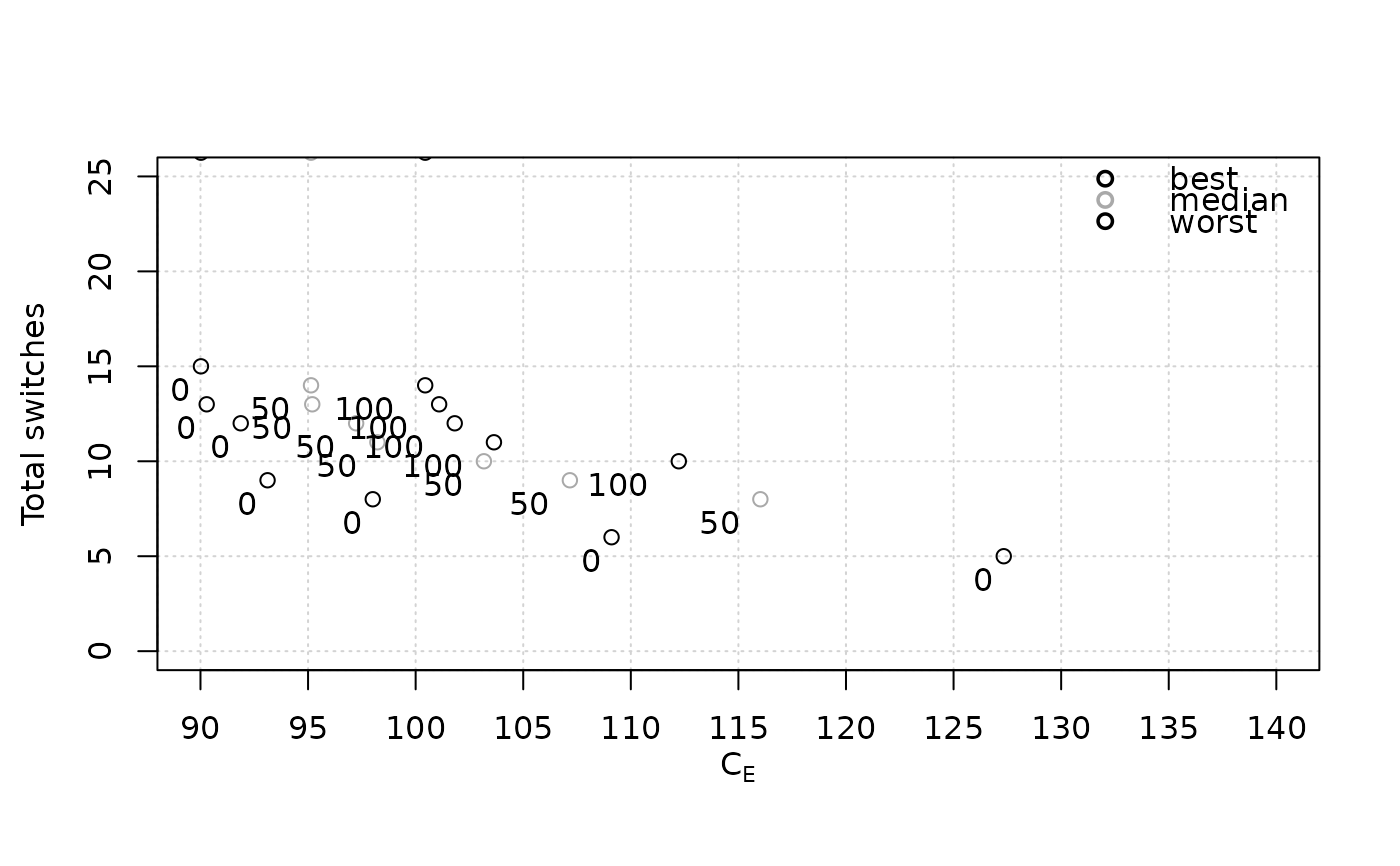
Convert a list of attainment surfaces to a single data.frame.
Arguments
- x
(list()) List of data.frames or matrices. The names of the list
give the percentiles of the attainment surfaces. This is the format
returned by eafplot() (and the internal function compute_eaf_as_list).
Value
A data.frame with as many columns as objectives and an additional column percentiles.
Examples
data(SPEA2relativeRichmond)
attsurfs <- eafplot (SPEA2relativeRichmond, percentiles = c(0,50,100),
                     xlab = expression(C[E]), ylab = "Total switches",
                     lty=0, pch=21, xlim = c(90, 140), ylim = c(0, 25))
attsurfs <- attsurf2df(attsurfs)
text(attsurfs[,1:2], labels = attsurfs[,3], adj = c(1.5,1.5))
