Conditional Pareto fronts obtained from Gaussian processes simulations.
Source:R/eaf-package.R
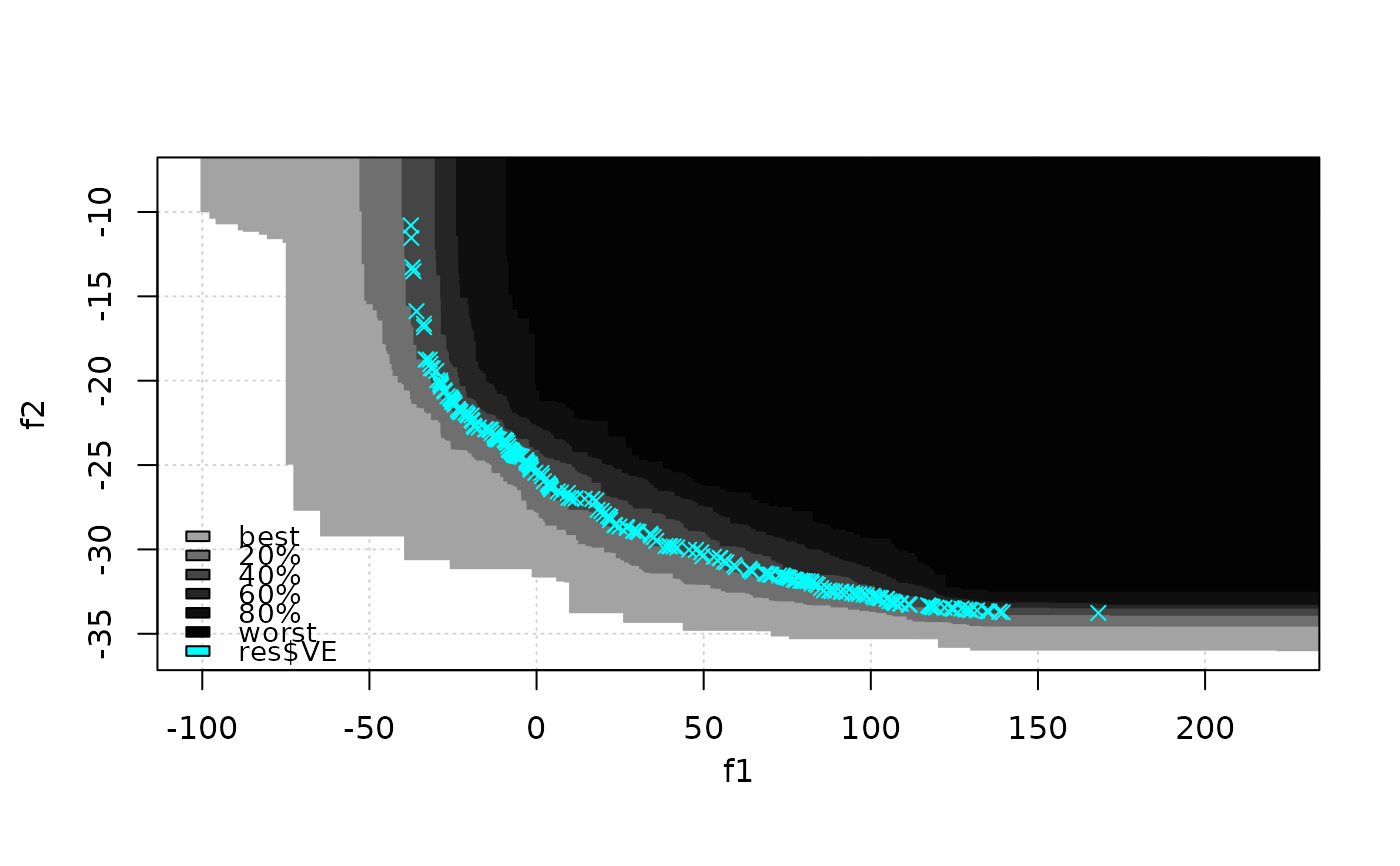
CPFs.RdThe data has the only goal of providing an example of use of vorobT() and
vorobDev(). It has been obtained by fitting two Gaussian processes on 20
observations of a bi-objective problem, before generating conditional
simulation of both GPs at different locations and extracting non-dominated
values of coupled simulations.